")
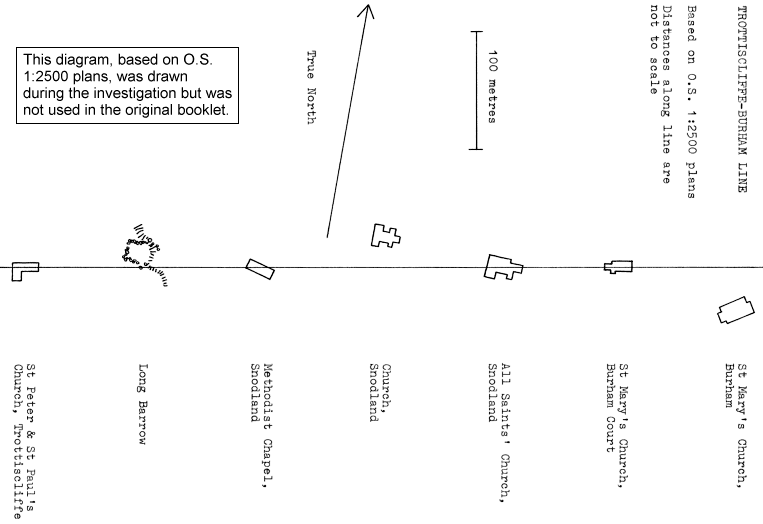
Fig. 1: Paper version, 1985
{1}
The Coldrum ley was first discovered in 1979 by Paul Devereux, editor of The Ley Hunter, on 1:50000 OS Sheet 188. A description of the ley was published in that magazine [1]. In 1984 the BBC asked us to carry out a statistical analysis of the ley for use in a television program “The Strange Affair of Ley Lines” to be shown early in 1986. In this booklet we present an account of our investigation.
The result of our analysis is negative. From a purely statistical viewpoint we see no evidence that the Coldrum ley is anything more than a chance alinement of sites. We should therefore mention that the Coldrum ley was chosen by Paul Devereux to feature in the BBC TV program (a) because it illustrated a number of ley concepts well, and (b) because it was close to London. (For film budget reasons it was necessary to cover a ley within about 120 miles of London.) It was not chosen because it was thought to be a statistically impressive ley. (It is certainly not one of the half-dozen or so statistically interesting alinements mentioned in New Scientist [2]). Indeed, back in 1979, shortly after it was discovered, one of us (Forrest) did some statistical analysis of the Coldrum ley, and concluded then that, apart from its shortness as a 7-point initial line, it was probably not statistically significant. Of course, that study was nowhere near as detailed as the present one (no attempt was made to determine the actual number of pre-reformation sites on Sheet 188, for example), but the point should be made that we knew at the outset that the Coldrum ley was not likely to shine statistically. In other words, we haven't here started with what we thought was a good statistical ley, and overturned it. Our computer simulations tended to confirm what we suspected from theory, though they did surprise us in the way they demonstrated the extraordinary and unexpected twists of chance.
The alinement as it first emerges from Sheet 188 (i.e. before post-reformation churches are discounted) consists of 7 primary sites (6 churches plus a long barrow) with one secondary site or confirmatory feature (a crosstrack with pond). A map of the line is shown in Fig. 1, and details of its seven sites in Table 1.
Following his initial discovery of the Coldrum alinement at the 1:50000 scale, Devereux naturally went on to investigate the dates of the churches involved in it, and to study the alinement on larger-scale maps and in the field. Two points arising from this subsequent research concern us here:
{2}
(i) As indicated in Table 1, two of the Snodland churches turn out to be
post-reformation, as does the church at Burham village. The alinement is
therefore properly one of only 4 valid ley markers (numbers 1, 2, 5 and 6) plus
the confirmatory crosstrack. Further details of the dates of the pre-reformation
churches (their possible Saxon origins) will be given later.
(ii) When the alinement of Fig. 1 is checked at the 1:25000 scale (sheet TQ 66/76) and 1:10000 scale (sheets TQ 66SW, 665E and 76SW) it is found that sites 4 and 7 (both post-reformation as it happens) fall off the line defined by the other sites (Fig. 2). Our enquiries at the OS revealed that this was probably the result of cartographical displacement at the 1:50000 scale, at which scale church symbols, which are disproportionately large for the sites they represent, are sometimes displaced slightly to avoid crowding or covering other, finer map detail in the vicinity. Churches 4 and 7 are not really in line with the other sites at all – it merely looks as if they are at the 1:50000 scale.
We do not believe that it is in any way significant that the two symbols which fall out of line as the alinement is studied at progressively larger scales are both post-reformation. Assuming that any church symbol is as likely to suffer cartographical displacement as any other, then, given that two church symbols in Fig. 1 are to fall out of line at larger scales, the probability that they are both post-reformation is simply (3×2)/(6×5) = 1/5, not a significantly low probability.
| No. | Name | Grid Ref | Date |
|---|---|---|---|
| 1 | St Peter & Paul’s Ch., TrottiscliffePronounced Trosley | 64632 60544 | Pre-ref |
| 2 | Coldrum Long Barrow | 65431 60723 | Neolithic |
| 3 | Methodist Chapel, Snodland | 70205 61704 | Post-ref |
| 4 | Church at Snodland | 70450 61784 | Post-ref |
| 5 | All Saint’s Church, Snodland | 70760 61822 | Pre-ref |
| 6 | St Mary’s Church, Burham Court | 71656 62009 | Pre-ref |
| 7 | St Mary’s Church, Burham | 72724 62195 | Post-ref |
Notes
(1) Grid references are of site centres.
(2) The crosstrack, left unnumbered as it is only a confirmatory feature, is at TQ684613.
Fig. 1: Paper version, 1985
")
Fig. 1: Web version, 2010
{3} Further information about the Coldrum alinement can be found in Appendix 1.

Click here for more detailed plan (2010)
We should first note that ley hunters attach different degrees of importance to various kinds of site. Primary ley markers include prehistoric sites and (according to most ley hunters) pre-reformation churches. Minor features such as ponds and crossroads are held to be confirmatory evidence only. When they fall on an alinement of primary sites they are counted as extra evidence, but they are not used to define a ley. In this booklet we exclude confirmatory features when counting the sites on a ley. Between these categories are various debatable sites, e.g. medieval castles and homestead moats. Some ley hunters count these as primary sites, others as confirmatory sites only.
The use of the computer is to answer the question: what would happen if the ley points were scattered over the map at random? Would there still be a fair chance of getting an alinement similar to the Coldrum ley? The computer first generates a fake OS map by placing the required number of ley points at random, then searches for “leys” among these. By repeating the process as often as possible (within a reasonable time limit) we can form an idea of what sort of alinements are or are not likely to occur by chance.
Because we wanted to throw light on ley hunting generally, as well as the Coldrum ley in particular, we experimented with various collections of sites.
(i) First we used any site on Sheet 188 that might turn out, on further investigation, to be a primary ley marker. This included all churches as well as moats and castles (447 sites, 10 simulations).
(ii) We then threw away all churches that turned out to be post-reformation, and also the moats, mottes and castles. This gave us a restricted set of primary ley markers, which, in our opinion, it is fair to use as a basis for assessing the Coldrum ley (128 sites, 100 simulations).
{4}
(iii) We then allowed moats etc. back in (163 sites, 50 simulations).
We did not include confirmatory sites such as crossroads in any of the simulations. Rather, we imitated ley hunters in looking for confirmatory sites after interesting alinements of primary sites had been found.
Our first aim was to model, statistically, Devereux’s initial discovery of the alinement on the 1:50000 sheet. As we did not yet know which churches were pre-reformation, which earthworks were medieval, and so forth, every map symbol which could possibly represent a ley marker was initially “fair game”, i.e. usable, but liable to rejection later on grounds of date, etc. The numbers of potential ley markers of various kinds are shown in Table 2. The grid-square distribution of the 447 sites is given in Appendix 2.
| Churches | |
| with tower | 92 |
| with spire | 59 |
| without either | 242 |
| remains of | 1 |
| Chapels | 2 |
| Abbeys | 1 |
| Tumuli, barrows, earthworks & forts | 13 |
| Stones | 1 |
| Castles | 9 |
| Moats | 24 |
| Mottes | 3 |
| TOTAL | 447 |
In the context of its initial discovery at the 1:50000 scale, the Coldrum ley is an alinement of 7 primary sites. An interesting feature of the alinement which attracts the statistician’s attention is its shortness (8.26 km) – short chance lines are much rarer than long ones. Besides the number of potential primary sites involved and the shortness of the line, the other important parameter of any alinement is its width. (For a discussion of ley width and its definition see our ManualThis was never published..) The width of the Coldrum line can be looked at in two ways:
(i) Reading off the grid references of the centres of the 7 sites from 1:2500 plans (Table 1), we can then calculate the minimum width of a rectangular strip which will cover the site centres. This implies a width of 52m on the ground.
(ii) On the 1:50000 map we are alining map symbols which, {5} in the main, are about 1 mm in diameter, corresponding to 50m on the ground. Since the line is allowed to pass through any part of a map symbol, this figure must also represent an approximate upper limit on the ley width.
Accordingly we took the width of the Coldrum line to be a round 50 m.
Could a line like the Coldrum alinement (a 7-point alinement of length 8.26 km and width 50m) have arisen purely by chance amongst the 447 potential ley markers on Sheet 188? We made some preliminary calculations to help us answer this question. Using the strip formula (see our Manual) with 2c = 50m, k = 40 km and n = 447 we can calculate the average number of alinements that would occur per map if the sites were scattered at random:
| 63.6 | 7-pointers |
| 6.6 | 8-pointers |
| 0.6 | 9-pointers |
| 0.05 | 10-pointers |
These figures suggest that amongst 447 sites, randomly placed in a 40-km square, a 7-point alinement of width up to 50m would not of itself be a statistical rarity. Even a 9-pointer could easily be produced by chance. Taking the length of the alinement into account, our calculations show (see Manual) that in a 40-km square only 0.0069% of chance 7-pointers should come out 8.26 km long or less, so that of the 63.6 chance 7-pointers predicted by the strip formula, only 0.0044 would be as short as the Coldrum line or shorter. Roughly speaking, one such line ought to occur by chance about once in every 250 maps.
However, both the strip formula and the calculation of the length factor assume that the sites have independent and uniform random disributions. That is, each random site is assumed to be placed without regard to the positions of the other sites and without preference for one part of the map over another. The actual distribution of the 447 sites on Sheet 188 isn’t quite uniform in this sense. The reason is fairly obvious. Most of these sites are churches, and these tend to cluster in towns like Sevenoaks or Maidstone, or even in smaller places like Snodland or Hawkhurst, to a degree which would not happen in a mathematically uniform scatter. (Some details of this non-randomness are given in Appendix 3). Since there is no known theoretical way to evaluate the effects of such clustering on the numbers and lengths of alinements to be expected by chance, we must turn to computer simulation to find out whether or not the shortness of the Coldrum line is as significant as the above calculations suggest.
{6}
The technique used here is simple. Firstly, it is assumed that each of the 447 sites on Sheet 188 can be fairly represented by a circular disk 1 mm in diameter. (This is a fair assumption in the majority of cases, but see Appendix 4 for details of actual site and map symbol sizes.) Alining such disks is, of course, equivalent to working with a ley width of at most 50m on the ground. Secondly, each of the 447 sites is given a random nudge within its 1-km grid square, that is, the centre of each disk is assigned a randomly determined position inside its grid square. This has the effect of shuffling round the sites an the map, but preserving the overall geographical distribution, including the clustering. Random nudging destroys any deliberate alinements there might be on the map, and any alinements the computer finds after nudging the sites must be just chance alinements. For details of the computer program see the Manual.
In each simulation we instructed the computer to find and print out all the alinements of 7 or more sites which entailed a ley width of not more than 50m. We were particularly interested in those alinements which “beat” the Coldrum line in either of two ways:
(a) By involving 7 sites, but in an alinement shorter than the Coldrum line.
(b) By involving 8 or more sites but without any restriction on length.
We ran 10 simulations like this, each one taking about 12 hours of computer time. We can roughly summarize the results as follows, more detailed results, with comments, being given in Appendix 5.
(i) Two of the simulations beat the Coldrum line by producing 7-pointers shorter than Coldrum. This shows that site clustering makes it much easier to find short alinements than our previous calculations suggested. We estimated that we would find only one such line in every 250 simulations.
(ii) We also noted that in the 10 simulations there were another six 7-pointers a bit longer than the Coldrum line, but still under 10 km in length. These would almost certainly attract the ley hunter’s attention just as much as the Coldrum line.
(iii) All ten simulations produced a surprising crop of 8-pointers (averaging about 10 per simulation), and 7 of the simulations produced one or more 9-pointers. All of these beat Coldrum on the number of sites involved, though most are rather long alinements which the ley hunter would perhaps not pursue even if he were to find them.
The implication of this result is quite simple: if {7} Coldrum-like alinements can happen so easily by chance in simulations, then the Coldrum line itself might have happened by chance on Sheet 188.
To give some idea of what these simulated alinements would look like on the map, we decided to take a look at the second of the ten simulations (Coldrum 2, as we called it). We chose this one simply because it was the first simulation to produce a 7-pointer shorter than the Coldrum line. The coordinates of the sites, after nudging, are shown in Appendix 6a, and a map of selected alinements is shown in Fig. 3. It shows all the “Coldrum beaters”, i.e. all the 8- and 9-point alinements, plus the one 7-pointer that was shorter than the Coldrum line. The other 7-pointers are not shown, but the complete printout of the alinements found is given in Appendix 6b.

Fig. 3
{8} The following may serve as a useful summary of Fig. 3.
Lines 1 & 6 are two 8-pointers close together which, in effect, merge to form a 9-point alinement.
Lines 2, 3, 4, 5 & 11 are all 8-pointers, line 4 being rather short for an 8-pointer (19.4 km).
Line 7 is a 9-pointer.
Lines 8, 9 & 10 are three 8-pointers, close together, and almost merging to form a 10-point alinement.
Line 12 is the short 7-pointer (8.07 km) which, coincidentally, starts in Snodland.
In addition to the six churches and the barrow, the primary sites of the Coldrum line, there is the secondary or confirmatory feature, namely the crosstrack with its (now dried up) pond. See also Appendix 1, paragraph 6. The question naturally arises: do chance alinements also pick up confirmatory features? Taking Coldrum 2 as a test case, we calculated the equations of the least squares lines of best fit (Table 3) for each of the 12 alinements in Fig. 3, and superimposed these lines on Sheet 188. We then scanned the lines for confirmatory features of the types which ley hunters would find acceptable – e.g. crossroads (except those in heavily built up areas), ponds, springs, wells, fords, markstones, and stretches of road or track running along or parallel to the lines.
Of course, the fact that we were plotting the lines by hand and eye, and on a relatively small-scale map, meant that our results at this stage were approximate only. Accordingly, having noted what looked like possible hits at the 1:50000 scale, we went on to check the accuracy at the 1:10000 scale. We give here merely a representative sample of the results (Map extracts 1 to 5, at the end of this booklet), with a map of the Coldrum crosstrack for comparison (Map extract 6). All are reduced versions of our investigations at the 1:10000 or 6″ to 1 mile scales. The following notes summarize the contents of each map extract.
Extract 1. Lines 1 and 6 are actually two distinct lines, here about 12m apart on the ground. The line (actually Line 6) picks up a road junction at A and a pond at B. Sections of path run roughly parallel to the lines at C and D. (Devereux notes that part of the Pilgrims’ Way roughly parallels the Coldrum ley to the north.) Note that the railway tunnel is roughly parallel to the line on one side, and a section of the London Road parallel to it on the other.
{9}
| No. | Grid ref. | Azimuth |
|---|---|---|
| 1 | 55844 46739 | 158.102 |
| 2 | 63540 46788 | 54.390 |
| 3 | 58825 45830 | 41.845 |
| 4 | 62016 49815 | 38.403 |
| 5 | 73590 55197 | 64.449 |
| 6 | 56268 45662 | 158.010 |
| 7 | 66647 45867 | 54.248 |
| 8 | 68914 49047 | 62.146 |
| 9 | 68602 48902 | 62.278 |
| 10 | 68828 49012 | 62.230 |
| 11 | 57458 41119 | 20.208 |
| 12 | 73115 57836 | 145.539 |
Notes
(1) The grid reference shows a point on the line (actually the centroid of the sites).
(2) Azimuths are measured clockwise from grid north.
Extract 2. Part of Line 2. Two road Junctions are picked up at A and B. To the SE a stretch of the A249 runs roughly parallel to the line.
Extract 3. Another part of Line 2. Fant Farm (at A), a junction of road and tracks presenting a tight target at the 1:50000 scale, becomes a wider, rather ill-defined, and not very convincing hit at this scale. There is a junction at B, and a complex of paths and tracks at C. Note the boundary stone at D, a small target hit squarely by the line.
Extract 4. Part of Line 3. Another rough parallelity, plus a junction of road, track and path at B. The line grazes the edge of a pond at A, and crosses another at C.
Extract 5. Part of line 11. Road junction at A; road weaves round line, alines with it briefly, then veers off. Another junction at B (possibly too far off line). The line grazes the edge of a pond at C.
We make no attempt to compare, quantitatively, the incidence of confirmatory evidence on the 12 lines of Coldrum 2 with that on the Coldrum ley. Our 12 lines together are about 31 times as long as the Coldrum ley, so we have much more scope in simulation for chance to operate. On the other hand, we have made no attempt to do a complete scan of the 12 lines: we merely followed up the more promising items that presented themselves when the lines of Coldrum 2 were superimposed on the 1:50000 sheet. The examples included here are thus a selection from a selection.
{10}
The next step is to follow the ley hunter in sorting out which sites involved in the simulated alinements are acceptably ancient. Each site in the simulations, remember, corresponds to a real site on the map, and thus inherits its nature and history. Given an alinement in any simulation we can thus say whether its sites are ancient earthworks, modern churches, or whatever, and from this decide whether or not the alinement would have counted as a ley had it turned up in a real ley hunt. In the case of the actual Coldrum line, 3 out of the original 7 sites must be rejected as modern features (they are post-reformation churches; see Table 1). This leaves a 4-point kernel of acceptable primary sites (3 pre-reformation churches plus the long barrow).
Taking Coldrum 2 as a typical test case we similarly weeded out the modern features, and isolated the kernels of each of the 12 lines in Fig. 3. The results can be summarized as follows.
Lines 1 & 6 turned out to consist purely of post-reformation churches. They contained no acceptable ley markers at all.
Line 2 turned out to have a kernel of 4 and possibly 5 acceptable ley markers, all pre-reformation churches.
Line 3 turned out to have a kernel of 3 acceptable ley markers: a tumulus, a pre-reformation church, and a moat. (The moat is arguably not a good ley marker, though.)
Line 4: this rather short 8-pointer turned out to have a kernel of 4 and possibly 5 acceptable ley markers. 4 of these are pre-reformatian churches, and the 5th, the questionable one, is a castle.
Line 5 turned out to have a kernel of 3 but possibly 5 acceptable ley markers. 3 are pre-reformation churches, and the two arguable sites are a moat and a castle.
Line 7 turned out to have a kernel of only 3 acceptable ley markers: 2 pre-reformation churches and an Iron Age fort.
Lines 8, 9 & 10 turned out to have a kernel of 3 or possibly 4 acceptable ley markers: 3 pre-reformation churches and a moat.
Line 11 turned out to have a kernel of only 2 acceptable sites, a pre-reformation church and a moat, the latter being arguable as a ley marker.
Line 12: the short 7-pointer fell very much by the wayside. It turned out to have a kernel of only 1 acceptable ley marker, this being a pre-reformation church.
{11} For further details see Appendix 7.
Comparison of these line profiles with the Coldrum line is quite revealing. As regards the numbers of sites involved in the kernels, the Coldrum ley is matched and possibly beaten by lines 2, 4 and 5. The common kernel of lines 9 and 10 possibly also matches the Coldrum line. The other simulated lines are beaten by the Coldrum line.
However, the kernels of the simulated lines are all longer and wider than the kernel of the Coldrum line (see Appendix 7), which could certainly be significant, since longer and wider lines occur more easily by chance than shorter and narrower ones.
Thus, though the similarities are interesting, we cannot really say, just from isolating the kernels of the lines in Fig. 3, whether or not chance is adequately matching the Coldrum ley. It is matching it on numbers of acceptably ancient sites involved in the kernels, but not on kernel length or kernel width, at least not in Coldrum 2. (We did not check out the other 9 simulations in the same way.)
The ley hunter would be just as happy to find the Coldrum ley as the kernel of a 5- or 6-point initial line as the kernel of a 7- or 8–point one. It is not the line he starts with that really counts – that is simply what first attracts his attention – but what he ends up with after the modern sites are discounted. What he ends up with, of course, is a function of the number of acceptable potential ley markers available for use in ley hunting on the map sheet with which he is working.
What we would really like to know, therefore, is whether or not a 4-point alinement like the Coldrum ley could arise by chance amongst the acceptable ley markers available on Sheet 188. To answer this we need to know how many of the 447 sites on Sheet 188 are “acceptable”, and this entails, principally, finding out how many of the churches are pre-reformation. The method of doing this is outlined in Appendix 8. The result was that we were able to identify 106 pre-reformation churches. These, plus 2 chapels and 4 abbeys, likewise pre-reformation in origin, and various stones, tumuli and earthworks, made a total of 128 acceptable sites, a list of which is given in Appendix 9, together with their grid-square distribution. Other pre-reformation sites which would probably be accepted by ley hunters if they fell on leys – e.g. moats or castles – were omitted as weaker targets at this stage. We wanted only what we called the “Main Preref” site list. These weaker targets are, however, listed in Appendix 9 for later reference.
Working with the 128 “Main Preref” sites, we asked if the {12} 4-point kernel of the Coldrum line – that is, the Trottiscliffe, Coldrum, Snodland, Burham line – could have arisen by chance. In other words, could chance produce a 4-pointer as short as or shorter than, and as tightly alined as or tighter than, the Coldrum ley (length 7.2 km and width 13 m or 20 m, as in Appendix 7).
We used the same method of simulation as before. Each of the 128 sites was given a random nudge within its 1-km grid square, and the computer set to work looking for acceptable alinements. In 100 such simulations we found 16 alinements which beat Coldrum. These 16 lines consist of:
(i) Thirteen 4-pointers as short as or shorter than, and as tight as or tighter than, the Coldrum ley.
(ii) A 5-pointer shorter than and as tight as the Coldrum ley (Simulation 61).
(iii) A 5-pointer slightly longer (12.3 km) than the Coldrum ley, but containing a 4-point subset shorter than Coldrum. This line is also as tightly alined as Coldrum (Simulation 87).
(iv) A 5-pointer slightly longer (11.1 km) than Coldrum, but just as tight as it. This line is of special interest, and we’ll come back to it shortly (Simulation 2).
Full details of these 16 lines are given in Appendix 10.
For the Coldrum ley to be statistically significant – that is, for us to really start believing that the ley isn’t just a product of chance – we’d have had to find no more than one alinement to match it in the 100 simulations. Since we found 16 such lines, and these without including arguable sites like moats in the site list, our simulations give no evidence that the Coldrum ley is anything other than chance.
It came as quite a surprise to us to find that the 16 Coldrum-beaters referred to in the last section all occurred in one fairly small region of the north-east quadrant of Sheet 188 – the very area in which the real Coldrum ley is found. Also, most were oriented vaguely east–west, again like the actual Coldrum ley. Fig. 4 shows all 16 lines together on one map, with the actual Coldrum ley superimposed (dashed line). When looked at in this way, the Coldrum ley certainly does look like a typical chance alinement.

Fig. 4
One of the good chance 5-pointers was of particular interest, as we mentioned above. In the second of the simulations using the 128 Main Preref sites the computer found that after nudging within their 1-km grid squares, the following sites had fallen into alinement:
(a) St Peter & St Paul’s Church, Trottiscliffe
(b) the Coldrum Long Barrow
(c) All Saints’ Church, Birling
(d) Kit’s Coty House (a megalithic burial chamber)
(e) White Horse Stone (a standing stone about 8 feet high)
A map of this alinement is shown in Figure 5. Trottiscliffe church and the Coldrum barrow are, of course, the two sites at the west end of the actual Coldrum ley, and here they are again on a simulated line. This is interesting because it presumably means that the simulated line takes over the tunnel legend attached to the actual sites – a legend which Paul Devereux takes to be confirmatory evidence for the ley (Appendix 1, paragraph 2) and which we can therefore use as “confirmatory evidence” for the simulated ley.
{14}

Birling church is dated as early 14th century in Newman [3] but is certainly much older than this, possibly Saxon. That the site of the church is ancient is suggested by the presence of sarsen stones “just outside the graveyard wall” [4]. Compare the sarsens at Trottiscliffe (Appendix 1, paragraph 5). Kit’s Coty House and the White Horse Stone are both prominent neolithic sites.
This quite spectacular fake ley also picks up some “confirmatory evidence” when it is superimposed on the landscape of Sheet 188 and the larger-scale maps of the area. There is a junction of a path and track at 7258 6027, and when the line is continued beyond the White Horse Stone it passes close to a hilltop crosstrack (one of the tracks is marked as ancient on the map) at 7766 5987, a good parallel for the Blue Bell Hill “initial point” of the actual Coldrum ley (Appendix 1, paragraph 8). In other words, we find our simulated ley conforming to the ley hunter’s “holy hill” pattern.
Could all this happen by chance? Well, it did!
It was pointed out to us that two of the three pre-reformation churches on the Coldrum ley are definitely of Saxon origin, and that the third (Burham Court) probably is too. Might it not be argued that this adds weight to the Coldrum ley, in the sense that its churches, being Saxon or probably Saxon, are more likely to incorporate pagan sites than some of the much later pre-reformation churches usually accepted by ley hunters?
Now, though no ley hunter known to us works to a Saxon-only rule for churches, and though we believe that all our 16 Coldrum beaters would be perfectly acceptable to a ley hunter in practice, we nevertheless decided to take our study further by investigating just how much added weight the Saxon dating gave to the Coldrum ley. (At {15} this stage we took it on trust that Burham Court church could be shown to be Saxon).
In the course of our research we came across an article by Ward [5] about a 12th-century manuscript known as the Textus Roffensis. Ward argues that this provides a list of churches which must have been of Saxon origin, and many of these are in the area of Kent which we are studying. If Ward is right, then the Textus Roffensis confirms that Burham Court was indeed Saxon. It also enables us to show that 7 and possibly 8 (Appendix 10b) of the 16 Coldrum beaters produced in the Main Preref simulations are similarly Saxon leys. In particular the Textus Roffensis passes Birling church, as well as Trottiscliffe, as Saxon, thus turning the fake Trottiscliffe to White Horse Stone ley into a Saxon-only alinement.
In other words, even taking Saxon dates into account, the Coldrum ley fails to show itself statistically significant.
As a matter of interest we also ran 50 simulations using the whole set of 163 sites in Appendix 9, referring to them as the “All Preref” simulations. Here we decided to look just for alinements of 5 or more sites. We found four 5-pointers under 15 km long and under 20 m wide. These are listed in Table 4a, together with two acceptably short 6-pointers which were also under 20 m wide.
(a) 5 or more points, maximum width 20m.
| Sim. | Ley | Length (m) | Width (m) | Sites |
|---|---|---|---|---|
| 8 | 11 | 12103 | 12 | 26– 58– 79– 87–145 |
| 16 | 2 | 15525 | 18 | 5–107–111–118–119–120 |
| 16 | 14 | 8779 | 19 | 5– 59–118–119–120 |
| 16 | 16 | 13234 | 7 | 73– 96–114–118–119 |
| 23 | 15 | 14934 | 13 | 58– 79– 87– 95–145 |
| 36 | 5 | 22055 | 19 | 13– 26– 44–109–110–132 |
(b) 7 or more points, maximum width 50m.
| Sim. | Ley | Length (m) | Width (m) | Sites |
|---|---|---|---|---|
| 26 | 10 | 28365 | 31 | 45– 49– 57– 58– 65– 81– 89–106 |
| 46 | 7 | 21702 | 40 | 1– 26– 51– 96–109–115–140 |
Increasing the ley width to 50 m naturally leads to a marked increase in the numbers of 5- and 6-point alinements. There seems little point in listing any of them here, but Table 4b shows the alinements of 7 or more points that occurred. It is a curious freak of chance that all the sites in the 8-pointer are pre-reformation churches, as can be verified by checking the site numbers {16} in Appendix 9. Not that this tells us anything about the Coldrum ley particularly: we mention it merely as a cautionary example for ley hunters generally. We suspect that ley hunters would be well pleased to find such a line, 31 metres wide or not!
When considered in the context of its original discovery, as a 7-pointer amongst 447 sites, the Coldrum line is seen not to be statistically significant.
When the modern sites are removed, and the line is considered as a 4-pointer amongst the 128 Main Preref sites, the line is again not statistically significant.
Thus we really do not have any statistical evidence that the Coldrum ley is anything other than chance. For ourselves, we think the line probably is chance. Granted, we haven’t considered intervisibility or the orientation of churches along alinements (Appendix 1, paragraphs 1 & 3), but the fact remains that as an alinement the Coldrum ley is not statistically significant. We do not think that “extras” like intervisibility and orientation – unless very convincing, which they aren’t in this case – can be used to overturn an unfavourable statistical result like this.
How does this study affect ley hunting as a whole? It doesn’t automatically disprove all leys, of course, and we would take issue with anyone who claimed it did. It merely casts grave doubt on the validity of the Coldrum ley itself. But our simulations may have repercussions for some leys which on the basis of theoretical calculations appear to have considerable statistical significance. Two prime candidates here are the Saintbury ley and the Craigearn ley. The point is that much of the statistical significance of those leys conies from their shortness, and one of the things we have learned from our simulations is that our estimates of the rarity of short chance lines may well have been wildly inaccurate on account of site clustering. So we may well have to re-think some of our statistical successes. How things turn out we hope to make the subject of future booklets in this series.