{824}
A statistical model for ley lines
Ley hunting usually begins on a 1:50 000 Ordnance Survey map, looking for alignments of ancient sites with a straightedge. A simplified version of this process can be statistically modelled as follows.

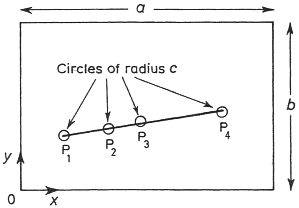
The map sheet is represented by a rectangle a units by b units, and each ancient-site map symbol by a small circle of radius c units. This is the first simplification because ancient sites and their map-symbols come in a variety of shapes and sizes. Nevertheless, standardising the map-symbols in this way does lead to valuable insights into the mechanics of chance alignment.
Suppose there are n ancient sites on the map, and that they are randomly distributed over it. Mathematically, the definition of random is the obvious one. If the eastings and northings of the sites are treated as x and y coordinates with the origin at the bottom lefthand corner of the map, then x is uniform on [0,a] and y is uniform on [0,b]—as shown in the diagram. The positions of the different sites are assumed to be independent.
The condition of random site distribution is the second simplification, for it is generally found that the overall distribution of ancient sites on a map is not quite random. Actual sites tend to cluster rather more than their randomised counterparts. Again, though, the random site model does give us available insight into the surprising degree to which ancient sites could be aligning purely by chance.
Next, we must define what we mean by sites being “in alignment”. There are several ways to model this mathematically, but the most realistic here is the following: in the diagram, sites P1, P2, P3 and P4 are aligned if a line can be drawn so as to intersect each of the circles representing them.
If the ley hunter allows near misses, then clearly this is equivalent to working with an increased c. Working with all these assumptions, Cambridge mathematician Michael Behrend derived an ingenious formula for the expected number of alignments of r sites among a total of n:
|
where G(r) is a tabulated function of r that also depends on the ratio a:b.
Note that the predicted number of r-point alignments includes those r-pointers that are parts of higher order alignments.
Another significant parameter in assessing the statistical significance of alignments is ley length. Behrend’s formula predicts numbers of alignments of any length consistent with the size of the map sheet under consideration. That is, for an a×b rectangle, chance alignments up to √(a2+b2) in length are included in the predicted total. However, it is not difficult to calculate what percentage of N(n,r) will be of a given length or less.