Double Dummy Results:

|
|---|
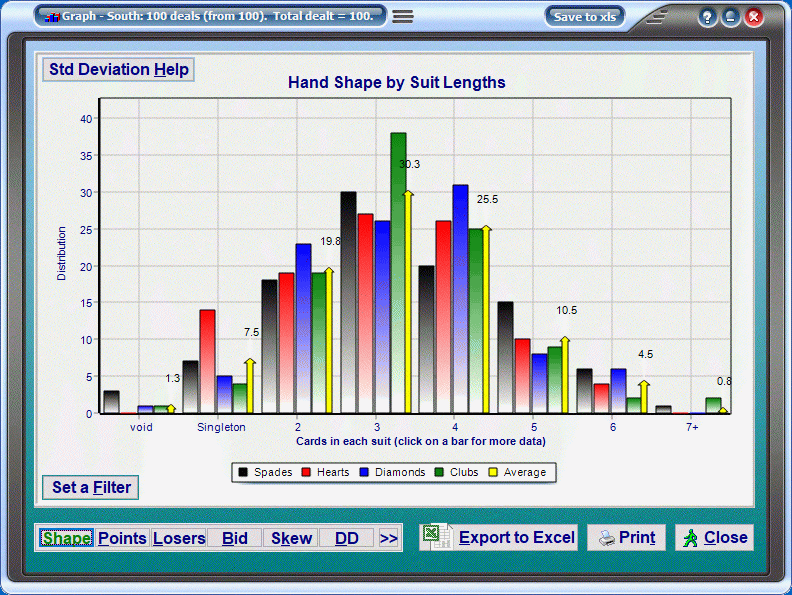
If you select the graph option on the DD options screen you will get the results presented to you like this:

|
|---|
Click the text below to see each graph page:
You can export this data to Excel if you have that software, or print it to a printer or file.
Clicking on any graph bar gives you information about standard deviation of the result and
the percentage of all outcomes represented by the bar - very useful if the total hands are
not a round number like 1,000 which is very likely if you use the filter options below.
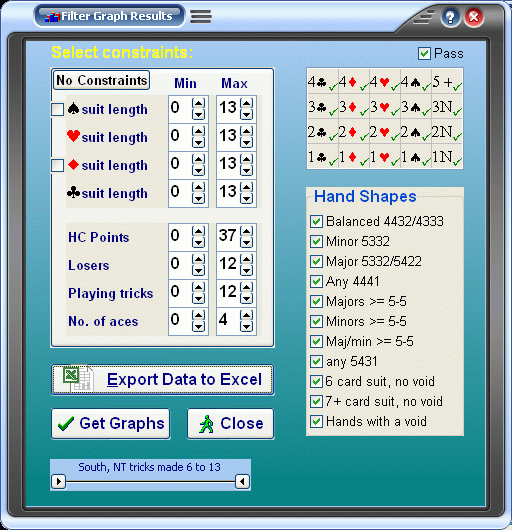
Set a filter brings up this menu:
 |
|---|
You can now filter out certain hands. So as an example if declarer had opened a weak NT
(12-14 points) and you were trying to work out whether 10 points and 6 spades was enough
to invite the graph initially will show how often 4S will make.
With the filter page you can remove the 12 counts (and 13 counts with 8+ losers if you wish)
to see what happens when partner accepts your invitation.
You can also look at trump support and see how often it makes opposite 4 trumps or 3 or 2.
Or you can set the tricks made to 10+ and look at the various graphs then try again with up
to 9 tricks and see what you can learn that helps you decide if you should
invite and when to accept an invitation.
If a filter is set the Excel export will only pass data on the filtered hands.
![]() Go back to the options screen
Go back to the options screen