Update to Appendix 2: Vertex Analysis
Michael Behrend, 2014
As in the original Appendix 2, we select some ley point O and seek the average number of leys of various orders that we can expect to find passing through O.
Let there be n ley points on the map, and let N′(r) be the expected number of r-point alignments passing through a particular ley point O.
We consider two versions of the problem:
- The point O is placed randomly, with the same distribution as the other n−1 points.
- The point O is fixed in advance, and the other n−1 points are then placed randomly.
In version 1, if the expected number of r-point alignments is N(r) then a simple combinatorial argument shows that the expected number of r-pointers through O is
|
(1) |
and this is true whatever the criterion for alignment may be.
Version 2 is harder and at the moment has to be treated by simulations. The expected number of r-pointers through O varies with the position of O, and simulations show that this variation increases with r.
As an example of version 2, simulations were done with 100 points distributed uniformly and independently in a unit square. Alignments were sought using a strip criterion, with a strip (ley) width x=0.002. With 100,000 simulations the mean numbers of maximal alignments of orders 3, 4, 5, 6 were:
| r=3 | r=4 | r=5 | r=6 | |
| N(r) | 676.24 | 74.272 | 5.3004 | 0.2845 |

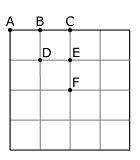
One of the points O was then fixed and the other 99 points were placed randomly as before. This was done six times with O fixed respectively at A, B, C, D, E, F (see diagram). With the same number of simulations, the mean numbers of maximal r-pointers through O, i.e. the estimated values of N′(r), were:
| r=3 | r=4 | r=5 | r=6 | |
| O = A | 19.55 | 2.901 | 0.2706 | 0.0186 |
| O = B | 17.34 | 2.199 | 0.1753 | 0.0102 |
| O = C | 16.52 | 1.958 | 0.1480 | 0.0082 |
| O = D | 21.09 | 3.205 | 0.2970 | 0.0199 |
| O = E | 21.71 | 3.319 | 0.3016 | 0.0188 |
| O = F | 23.38 | 3.989 | 0.4067 | 0.0277 |
It appears from this and other examples that the greatest number of alignments through O occurs when O is at the centre of the square (F), and the least when O is at the midpoint of a side (C). In this example, there are more than 3 times as many 6-pointers through F as through C.
The average number of alignments as O varies over the square should of course agree with formula (1). This average can be estimated, using symmetry and Simpson’s rule, as
|
The average was calculated both ways as a check, with reasonable agreement considering that all values are derived from simulations:
| r=3 | r=4 | r=5 | r=6 | |
| Simpson’s rule | 20.16 | 2.952 | 0.2650 | 0.0170 |
| N(r)×r/n | 20.29 | 2.971 | 0.2650 | 0.0171 |
Applications
1. Major Tyler’s Wooburn case
As in the section on Wooburn in Further Studies, the region covered by Tyler’s Fig. 3 is assumed to be a 25-mile square centred on Wooburn Church.
On the assumption that 400 ley points are valid, 20,000 simulations were carried out for alignments through the church, using a strip (ley) width of 0.02 miles. The mean values of N′(r), i.e. the number of r-point alignments through the church, were:
| N′(3) | = | 115 | .38 |
| N′(4) | = | 33 | .67 |
| N′(5) | = | 5 | .69 |
| N′(6) | = | 0 | .67 |
These figures for chance alignments are higher than those calculated in the original Appendix 2, and confirm that Tyler’s leys through Wooburn Church are not statistically significant.
2. Tyler-like simulation
Here 150 points were placed in a square of side 11 units, with a ley width of 0.025. To check the original results, 10,000 computer simulations were done. With one of the points fixed at the centre, and the others placed at random (independent uniform distributions), the mean number of 3-pointers through the centre point was 40.8, with a standard deviation of 6.2. Again, the mean from computer simulations is somewhat higher than the value calculated in the original Appendix 2, which confirms that Tyler’s pattern is not statistically significant.