{8}
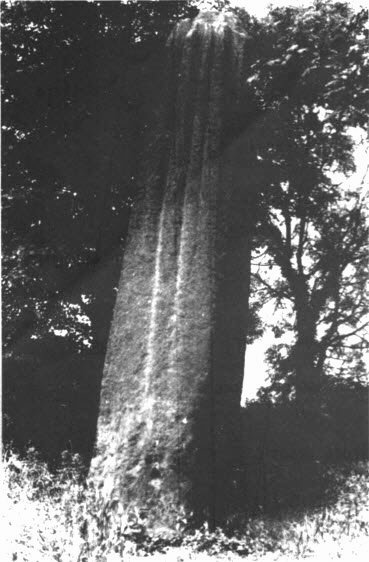
For “Lines on the LandscapeBook by Nigel Pennick and Paul Devereux (London, Robert Hale, 1989)” BOB FORREST and MICHAEL BEHREND kindly used the most sophisticated computerised statistical methods available to test an Oxfordshire alignment (which failed) and the Yorkshire lines involving the three giant Devil’s Arrows megaliths (the tallest shown here) which, as will be seen, smashed the statisical requirements …
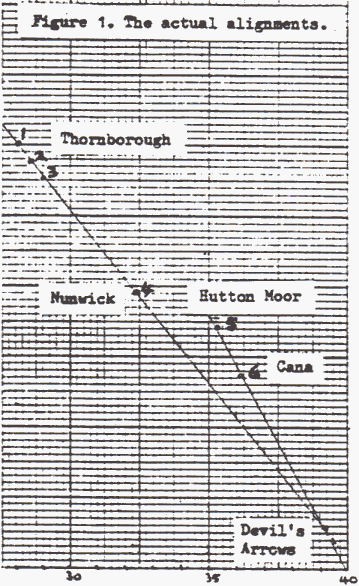
There are two alignments here, these being as shown in fig. 1. A site list with grid references is given in table 1. The lines were first noted by Norrie Ward (1) and later by Paul Devereux and Ian Thomson (2).
We should first define what we mean by “alignment” here. It is sometimes claimed that the Devil’s Arrows stones were meant to be used pair-wise as indicators of the henges. However, an investigation based on the positions of the stones as they are plotted on the 1:10,000 O.S. maps failed to give any real support for this claim. It is possible that small plotting errors by the O.S. are to blame for this, but of course this is purely conjecture, and we feel that before we can accept the claim of pair-wise use, an accurate field survey is called for, to determine exactly what directions are indicated by the three possible pairs of stones, and how these directions relate to the henges.
Now, though we feel there is insufficient evidence of a pair-wise use of stones, it is still true that it is possible to draw a straight line through the three Thornborough henges and the Nunwick henge which passes through at least one of the Devil’s Arrows. Consequently it was this definition of alignment which was used in the computer simulations which we now describe.
The alignments of fig. 1 are immediately statistically interesting, despite the {9} obvious fact that the three Thornborough henges are not precisely aligned with each other. This is because the Devil’s Arrows appear to be the only standing stones in the area (and very prominent ones at that), the henges the only henges in the area, and yet all are involved in the two alignments. Of the six henges, five appear on the latest 1:50,000 sheet (no. 99) and only Nunwick doesn’t. It can be found on 1:10,000 sheet SE37SW, however, marked as “henge (site of)”. Analysis of 1:50,000, 1:25,000 and 1:10,000 sheets of the Vale of York reveals no further henges, this analysis being confirmed by a list of henges compiled by Aubrey Burl (3). Likewise there appear to be no other standing stones in the immediate area besides the Devil’s Arrows. The only standing stones which came to light at all were in SE1280 (twin standing stones) and in SE6593 (a single standing stone). Both are shown on the 1:50,000 sheets (nos. 99 and 100), but as both are out on the moors, outside the Vale of York itself, the latter in particular being too far away from the henges (about 40 km) to be realistically associated with them, they were not included in our site list. Thus the six henges and the three Devil’s Arrows can be taken to be the only members of a geographically well-defined group of sites, and it was with these nine sites that our simulations were done. (4)
In simulation each henge was represented by a circular disk of diameter equal to that of the actual site. These diameters are listed in table 1. Each of the Devil’s Arrows was represented by a disk of diameter 5 metres. This size is determined partly by the thickness of the stones and partly by the standard vector error of the OS maps: the positions of the actual stones cannot be determined precisely from OS maps simply because the OS do not claim to map their positions with absolute accuracy. With the sites represented in this way, the method of simulation was one of randomly nudging both henges and Devil’s Arrows, so as to destroy any existing alignments, then analysing the nudged sites to see if any new alignments had been formed comparable to the real ones of fig. 1.
With six henges and three Devil’s Arrows we need to define what we mean by “comparable” alignments. Recalling what we said above, we are looking for situations in which a line can be drawn through a set of henges so as to pass through at least one Devil’s Arrow (5). Denoting the six henges by a,b,c,d,e,f and “at least one Devil’s Arrow” by D, the following alignments of henges and stones could be considered comparable (6) to the lines of fig. 1:
| (i) | an a–b–c–d–D line plus an e–f–D line; |
| (ii) | an a–b–c–D line plus a d–e–f–D line; |
| (iii) | an a–b–c–d–e–D line (plus an isolated henge, f); |
| (iv) | an a–b–c–d–e–f–D line. |
Configuration (i) is that of the real sites in fig. 1, of course. Configuration (ii) is different, but certainly comparable, in the sense that we would have been just as intrigued had we found such a configuration amongst the real sites as one of type (i). Likewise with (iii) and (iv), the latter being even more convincing of “ancient design”, if anything, than fig. 1!
We have already mentioned that the sites are “randomly nudged” in each simulation, but one needs to define that term quite carefully.
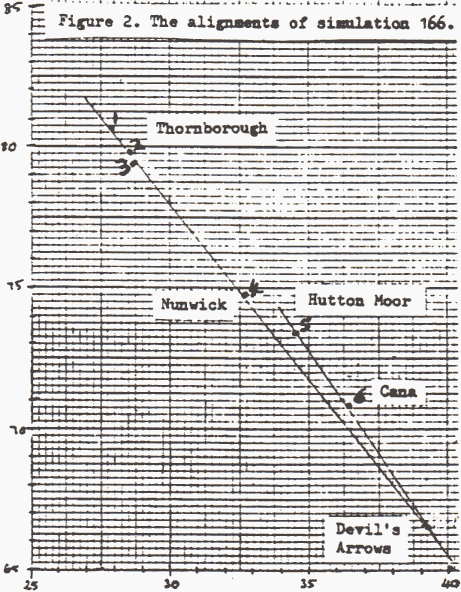
In the first 200 simulations the three Devil’s Arrows were nudged independently each in a disk of radius 100 metres centred on the actual {10} stone. The six henges were likewise nudged independently, each in a disk of radius 1000 metres centred on the actual henge (7). The computer was set to search for configurations of type (i) to (iv) in each simulation. In 200 simulations, only one (no. 166) matched the real sites, with a configuration of type (i), suggesting that the actual configuration of henges and stones in the Vale of York is significant at the 1 per cent level. The positions of the various sites in simulation 166 are shown in fig. 2. As can be seen, the situation is very similar to that of fig. 1. So similar, in fact, that it prompted us to have some reservations about the true statistical implications of this first set of simulations.
What worried us was that with the henges being about 200 metres in diameter, a random nudge of up to 1000 metres might not be enough to satisfactorily disperse the real alignments, just as an insufficient shuffle can fail to properly mix a pack of cards. Thus fig. 2, as one simulation out of 200, might not be giving us a true picture of the statistical worth of the Devil’s Arrows lines, since we might effectively only be measuring the probability of getting something like the real lines back again after an “insufficient suffle”. Clearly if the probability of “undoing a shuffle” is 1 in 200 then the statistical worth of the alignments in fig. 1 is probably rather greater than even these simulations suggest.
The obvious answer is to disperse the real sites more, but one problem here is that if we start nudging the henges by up to say 5000 metres instead of 1000 metres, then this might disperse the Thornborough group as well, whereas these three henges ought to remain a group in any realistic simulation.
A way round this is as follows. First the north and south Thornborough henges are nudged independently by up to 1000 metres, but then the group as a whole is nudged by up to 5000 metres. In effect these two nudges shuffle the Thornborough henges amongst themselves, and move the group as a whole. The other three henges are simply given independent random nudges of up to 5000 metres, whilst. the three Devil’s Arrows are given nudges of up to 100 metres, just as before.
Four hundred simulations of this type were done, the computer again searching for henge configurations of the types listed earlier. None were found at all, which would seem to lend the Devil’s Arrows lines of fig. 1 considerable statistical weight. A further four hundred simulations of the same type confirmed this by again failing to turn up any configuration to match the real sites. Thus it is extremely unlikely that the henges in the Vale of York have lined up on the Devil’s Arrows purely by chance, and “accidental coincidence” (to use a phrase of Watkins) is not a satisfactory explanation of the alignments.
NOTES AND REFERENCES:
(1) Norrie Ward, Yorkshire’s Mine (1969), ch. 11 (p. 103f)
(2) Paul Devereux and Ian Thomson, The Ley Hunter’s Companion (1979); [The Ley Guide, Empress, 1987]
(3) Aubrey Burl, Archaeological Journal, vol. 126, p 1–28 (1969)
(4) Though geographically we feel justified in excluding the twin standing stones in SE1280 from the site list, we feel that, “just in case” we are wrong, we ought perhaps to run some simulations with them in. Though not in the Vale of York itself, nevertheless these stones are only about as far from the Thornborough Henges as the Devil’s Arrows are. True, they are not labelled in antique script on either the 1:10,000 or 1:50,000 sheets, so they may well not be ancient (though if they aren’t, what are they? Does any reader of TLH know?) Nor do they line-up in practice with any of the henges (using the definition of “alignment” adopted in this report.). Nevertheless, to avoid any possible charge of “statistical bias”, we do propose to run some simulations with these stones included in the site list. Unfortunately these have not been done at the time of going to press, though it seems unlikely that their inclusion will drastically alter the statistical picture of the Devil’s Arrows lines outlined in this report.
(5) We are not much concerned here with whether or not a line through a set of henges passes, in simulation, through more that one of the Devil’s Arrows. (We would be more interested if we were concerned with a pair-wise use of the stones to indicate henges, but as we have already said, there is no real evidence for this yet.) Here we are solely concerned with the alignment of henges on the Devil’s Arrows group. In any case, with the stones represented by disks of diameter 5 metres, for reasons already stated, we can hardly talk in terms of precise alignments amongst them.
(6) We should perhaps explain why these configurations are “comparable” to that of the actual alignments. If a line can be drawn through N henges so as to pass through at least one Devil’s Arrow, then that line is defined to have a score of N − 1. The actual lines of fig. 1 thus score 3 and 1 respectively, a total score of 4. For a simulated configuration to match the real sites, therefore, its line(s) must attain a total score of 4 or more. Configurations (i) to (iv) are those which do this.
(7) Henges being fairly large sites we had to guard against simulations in which nudged henges ‘overlapped’. That is, the random nudging was done subject to the constraint that for any pair of henges, the distance between their centres was greater than the sum of their radii.