{10}
By Robert Forrest
Nearly three years ago I first read the claim that ley lines were much more numerous than chance alignments. My researches into leys began with the statistical investigation of this claim. I was to find that it was a false claim and that, all too often, it was a claim made by those ill-qualified to make it. From ley lines I developed formulae and other techniques for the investigation of other types of geometrical configurations amongst ancient sites. The results which emerged carried a message: never underestimate the power of chance.
At the outset let me explain that these techniques apply purely to map work, usually 1″ O/S or 1:50,000 O/S maps, and usually single sheets, though the techniques are easily extended to cover other scales or several maps in conjunction. They consider the map as a plane (intervisibility, for example, is not considered), and the various ancient sites (referred to as ‘ley points’) as ‘blobs’ on that plane. The object is to investigate the geometric configurations of these ‘blobs’ without regard to the actual terrain, and without regard to other factors such as folklore or fieldwork. In short, the techniques reveal some interesting results. They certainly show the inadequacy of what I call the “1″ map game”, and they certainly show that caution should be exercised as regards conclusions to be drawn from any sort of mapwork.
There are two main avenues of approach to the problems.
It is frequently argued that the likening of ley points to random points cannot constitute a fair model. The care lavished by the builders of a pre-reformation church, for example, rebels against the notion that such a site can be fairly represented by a random ‘blob’. But this is to misunderstand the basis of the model.
Let me take an example. Sheet 147 of the old 1″ O/S mapsThese covered 45 by 40 km contains 468 churches. Doubtless each individual church has its site specially chosen. But was each individual church deliberately sited with respect to every one of the other churches? Very probably not. Similarly, though each tumulus over an area was individually sited, and though certainly some tumuli may have been deliberately sited with respect to some others, it is very unlikely that all tumuli were deliberately sited with respect to all others.
In fact, when one considers the overall distribution of sites throughout an area, that distribution is fairly closely approximated by a corresponding number of randomly placed ‘blobs’ over the same area (Table 1).
| Number of churches per | Frequency | |
| km. grid square. | Observed | Expected |
| 0 | 1492 | 1388 |
| 1 | 203 | 361 |
| 2 | 74 | 47 |
| 3 | 17 | 4 |
| 4 or more | 14 | 0 |
| 1800 | 1800 | |
{11} In this table the observed frequency column shows the actual distribution (according to grid squares on the map) of the 468 churches on sheet 147. The expected frequency shows the theoretical distribution of 468 random blobs on the same map.
The actual distribution is not quite random, as can be seen, since churches tend to cluster (in towns) more than random blobs would. Nevertheless, the table does show that the random point model is not entirely invalid.
Very well then, the overall distribution of ley points in an area can be likened to a set of random blobs over the same area.
Now random blobs have predictable (and chance, since the blobs are random) geometric configurations, alignment properties etc., which can be investigated either statistically or by computor analysis. It follows therefore that actual ley points (or rather, their representations on the map) will carry with them a similar number of (also chance) geometric configurations over and above any such configurations that might have been deliberately incorporated by the builders. The problem then becomes one of where chance ends and deliberate design begins.
One thing is clear: it is very easy to pick out intricate patterns of sites which statistical investigation shows could easily be due to chance, and to mistake them for instances of deliberate design. Intricacy is not an infallible guide to deliberate design, and unaided intuition is an all too fallible judge of chance.
Let us concentrate simply on ley lines, and let me begin by describing an actual computor simulation of ley hunting.
The computor was given a square ‘map’ 50 units by 50 units, with 200 random blobs on it. It was asked to join each pair of blobs in turn and to count the number of other blobs that fell in alignment. The criterion for alignment was that the centre of a blob should fall within 0.01 unit of the line.
After performing literally millions of calculations in (for it, the long time of) 43 seconds, the computor printed out the numbers of distinct alignments it had found. The results are summarised in table 2.
| 752 | alignments | each | of | 3 | points |
| 33 | „ | „ | „ | 4 | „ |
| 2 | „ | „ | „ | 5 | „ |
What the computor did here was equivalent to a very thorough and precise ley hunt on a complete 1:50,000 O/S sheet (25 miles by 25 miles) containing 200 ley points. It was thorough because all possible alignments were sought out. It was precise because it was done consistently to the equivalent of a ley width of 0.01 mile: in other words, a blob on the map was accepted as being ‘on’ a pencil line only if that pencil line went through the centre of the blob in question.
In practice, since O/S symbols can be aligned more loosely (because of their size on the map) the ‘through the centre’ criterion adopted by the computor was rather stricter than the usually adopted ley width in map work, and as the ley width is relaxed, and looser alignments are ‘acceptable’, the number of chance alignments increases, and higher order chance alignments (of 6, 7 and more points) begin to appear. The above figures, therefore, can be taken as the minimum number of chance alignments to be expected amongst 200 ley points on a single and complete 1:50,000 O/S sheet. (Note 1.)
{12} Incidentally, these figures are also closely reproduced by statistical formulae (Note 2) designed to calculate the numbers of chance alignments amongst random points. The principal reason behind the computor experiment was in fact to test these formulae.
The implication of figures such as above is quite plain. To discount chance as a factor in ley hunting, the ley hunter must do at least one of two things. Using the computor data in illustration, he must either produce valid alignments, under this 0.01 mile criterion, of say 7 or 8 (preferably more) points, which the computor did not find in a chance run, or else he must produce alignments of 4 or 5 points in numbers far transcending the chance expectation figures of (respectively) 33 and 2 lines. (Note 1 again).
If the ley hunter cannot find such alignments then he has not discounted chance, and has not proved his case unless there are very good reasons for otherwise believing. The statistical hypothesis, as I have said earlier, does not account for fieldwork or folklore etc, and indeed the validity of such lines of research is not the concern of the present article.
In this sense, statistics does not ‘disprove’ leys. It merely fails to back them up, and thus throws the burden of proof onto other types of evidence.
Statistics does, however, tend to disprove that oft bandied about claim that leys transcend chance both as regards the number of sites found in individual alignments, as well as in the multiplicity of leys. I have analysed the expected chance alignments in a dozen different areas of the British Isles. Not once have I seen leys triumph over chance in their multiplicity, and not once have I found an individual alignment of points that stretched chance as a possible explanation (Note 3). Even the alleged high order Warminster leys (Note 4), when all the factors of Note 1 are taken into consideration, do not appear to transcend chance.
I find it curious that if a network of leys, of the extent often claimed by ley hunters, was ever actually laid out across our countryside, than that network should not show up above the chance alignments to be expected amongst those same points.
Finally, the above theory was designed originally to test the Watkins ‘at least 4 points’ criterion for leys – a criterion which Watkins appears to have accepted as putting alignments beyond the reach of chance! The theory does not apply to alignments of the ‘outlier’ variety of Professor Thom (Note 5), and does not say anything about individual alignments of ancient sites (Note 6). The theory was designed only to tackle the incidence of chance alignments over an area, or, as Nigel Pennick has put it, the leys-all-over-the-place hypothesis.
I pointed out earlier in this article that the overall distribution of ley points was only approximately random. The problems of producing formulae to calculate expected numbers of chance alignments amongst non-random points become very complex and may even be effectively impossible. Simulation is an ideal way of side stepping the formula difficulty.
The way this is done is as follows: the distribution of the genuine ley points over an area is first ascertained. This is done grid-square wise, as for the churches in table 1.
{13} A class of pseudo ley points is then sought out such that this set of points (which may include pubs, gas works, hospitals etc) has the same grid square distribution over the same area as the genuine ley points. These pseudo ley points are then studied for geometric configurations, alignments etc in the knowledge that any such found will be chance effects (Note 7).
One such experiment I carried out involved 230 named buildings in an area of South Wales (1:50,000 O/S sheet 145; Cardigan). In the main these buildings had names beginning with F, P or C, with some randomly chosen buildings in addition in order to build up the distribution to match that of the genuine ley points over the same area.
The result was so many alignments of 4 points that I very soon ceased to count them. A network of some 40 alignments, each alignment of at least 5 buildings, emerged from the map as I studied it. Of these 10 alignments each consisted of 6 buildings, and one alignment of 7 buildings (Fig 1). These results thus confirmed, for a non random distribution, the suspicions aroused by a corresponding but purely random one. Chance does play intuitively, unexpected tricks of alignment.
Simulation techniques such as the above can also be used to find out whether or not various types of geometrical configurations can similarly be expected to arise by pure chance.
For example, parallel leys and ley centres are both found in simulations. By the latter, I mean places where three or more ley lines cross, but at which places, at least according to O/S maps, no ancient monument of any kind stands.
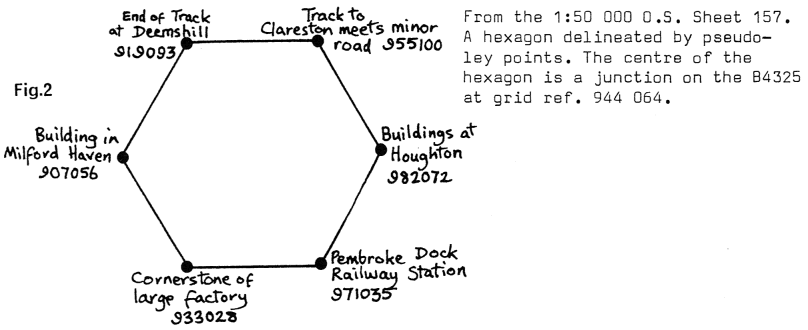
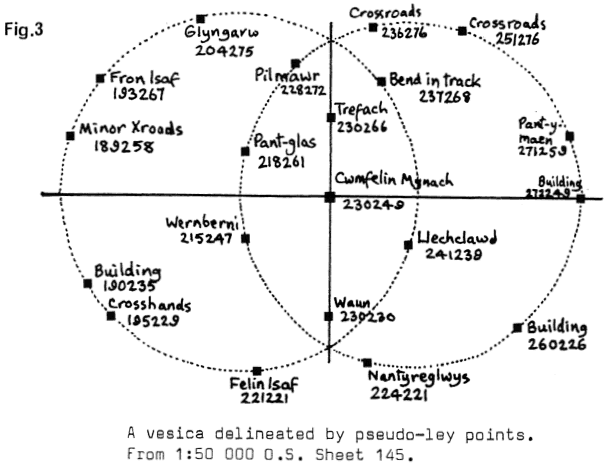
As to geometric figures being delineated by ancient monuments, I have found, in considering pseudo ley points of all types (i.e. without restrictions as to total number of spatial distribution) over only two different 1:50,000 O/S sheets, that complex geometrical structures can easily arise by chance. Pythagorean Triangles are to be found to an intuitively surprising degree (Note 8), and examples of a vesica and a regular hexagon are here appended (Figs. 2 & 3).
The implication is again quite clear. If such geometric configurations can arise by chance, how are we to know whether or not these same configurations, when observed in genuine ley points, are cases of deliberate design or simply mere chance? And again, is it not curious that alleged deliberate designs should so often be equalled and even excelled, by chance effects?
It only remains to be said that the above comments on geometrical design versus chance do not apply to Professor Thom’s work on Megalithic Sites. Those comments apply only to geometrical configurations formed by the juxtapositions of monuments, and not to geometrical configurations within individual stone circles.
1. The number of chance alignments to be expected in a given area depends upon
a) the size and shape of that area
b) the number of ley points in that area and
c) the accepted tightness of alignments criterion or ley width.
Another computor simulation, using the same points on the same map as for Table 2, only this time couting a blob as on a line if the centre point of that blob fell within 0.03 units of the line, revealed
| 174 | alignments | each | of | 4 | points |
| 17 | „ | „ | „ | 5 | „ |
| 3 | „ | „ | „ | 6 | „ |
{14} These figures demonstrate clearly that there are more ‘loose’ alignments in an area than ‘tight’ alignments.
In view of a), b) and c) it can be a tricky business evaluating what sort of chance alignments can be expected over a given area. In some areas of Britain chance alignments of six or seven points are commonplace; in other areas, they are rarities. Figures for one area cannot usually be applied to others. I stress this because there will doubtless be some who read this who will look at the above table and see 3 chance alignments of order 6, and who will have in their possession maps on which they have found, say, a dozen leys or order 6, and possibly some of higher orders. No conclusion can be drawn from such a comparison unless the parameters a), b) and c) for the maps in question agree precisely with the corresponding values for the computor work.
b) is the principal factor behind the claim that the Warminster leys could be accounted for by chance.
2. In my early work on chance alignments I used an adaption of the Furness Formula as given in Paul Screeton’s Quicksilver Heritage p. 56–58. The Furness Formula, however, is wrong – it predicts too many chance alignments; The formulae referred to here are a different set of equations of my own.
3. The Lands End Computer Study in The Ley Hunter 70 looked for a while as if it had broken the chance barrier, but for reasons rather too lengthy to go into here, this is no longer certain. There is an objection to this study, which will take a considerable amount of work to sort out.
4. See The Ley Hunter 45, article by Jimmy Goddard. Also Note 1 above.
5. See Megalithic Sites in Britain p. 59, fig 6.3.
6. It is no use, for example, a ley hunter sending me a diagram of a particularly interesting ley which he claims to have discovered somewhere or other, and asking me to apply my formulae to it. It is impossible to say whether or not such an individual ley is a chance effect without considering it in the context of the chance alignment potential of the total area in which it was discovered. For this reason I forsee Mr. Michael Balfour’s proposed Ley Gazetteer of Britain doomed to failure.
Once the area has been evaluated, of course, it is possible to say whether or not individual leys in the group are likely to be of chance origin.
There are alignments of sites, of course, where the alignment is known to be deliberate – for example, the Kilmartin Linear Cemetery (see Ancient Carvings in Britain Evan Hadingham, p. 84–85) where the sites follow each other down a valley. If such deliberate alignments are few in number and involve relatively few sites they will not ‘show up’ statistically; however, it has been claimed that the ley system transcends simple chance, and it is this claim which is under investigation here.
7. I am well aware that what I take to be non-ley points are actually claimed by some ley hunters to be true ley points. Cross roads, to cite one instance, and some farm houses to cite another. However, in the main, my pseudo-ley points are just ordinary modern buildings and unless one is prepared to argue that pubs, for example, are subconsciously sited in relation to each other, and in relation to Post Offices, Factories and the like, so as to map out megalithic geometry structures, any alignments and so forth can be safely claimed as chance.
8. See my article in Fortean Times, issue 16.